The D10, D50, and D90 of hydroxyapatite (HAp) powder describe the particle-size distribution under defined test and dispersion conditions. The measured population may include dispersed particles or agglomerates that were not fully deagglomerated. A spray-dried microsphere is a secondary particle formed as an atomized slurry droplet contracts and solidifies. These are different material levels and different statistical objects.
A 2026 study in Chemical Engineering Research and Design varied poly(vinyl alcohol) (PVA) concentration to examine how HAp slurry rheology affected spray-dried particles. The study produced spherical microspheres with a mean diameter near 40 μm. The more useful finding, however, is not the number itself. It is the process link between slurry state, droplet formation, drying, and the final particle structure.
Turning Powder into Microspheres Is More Than a Change in Size
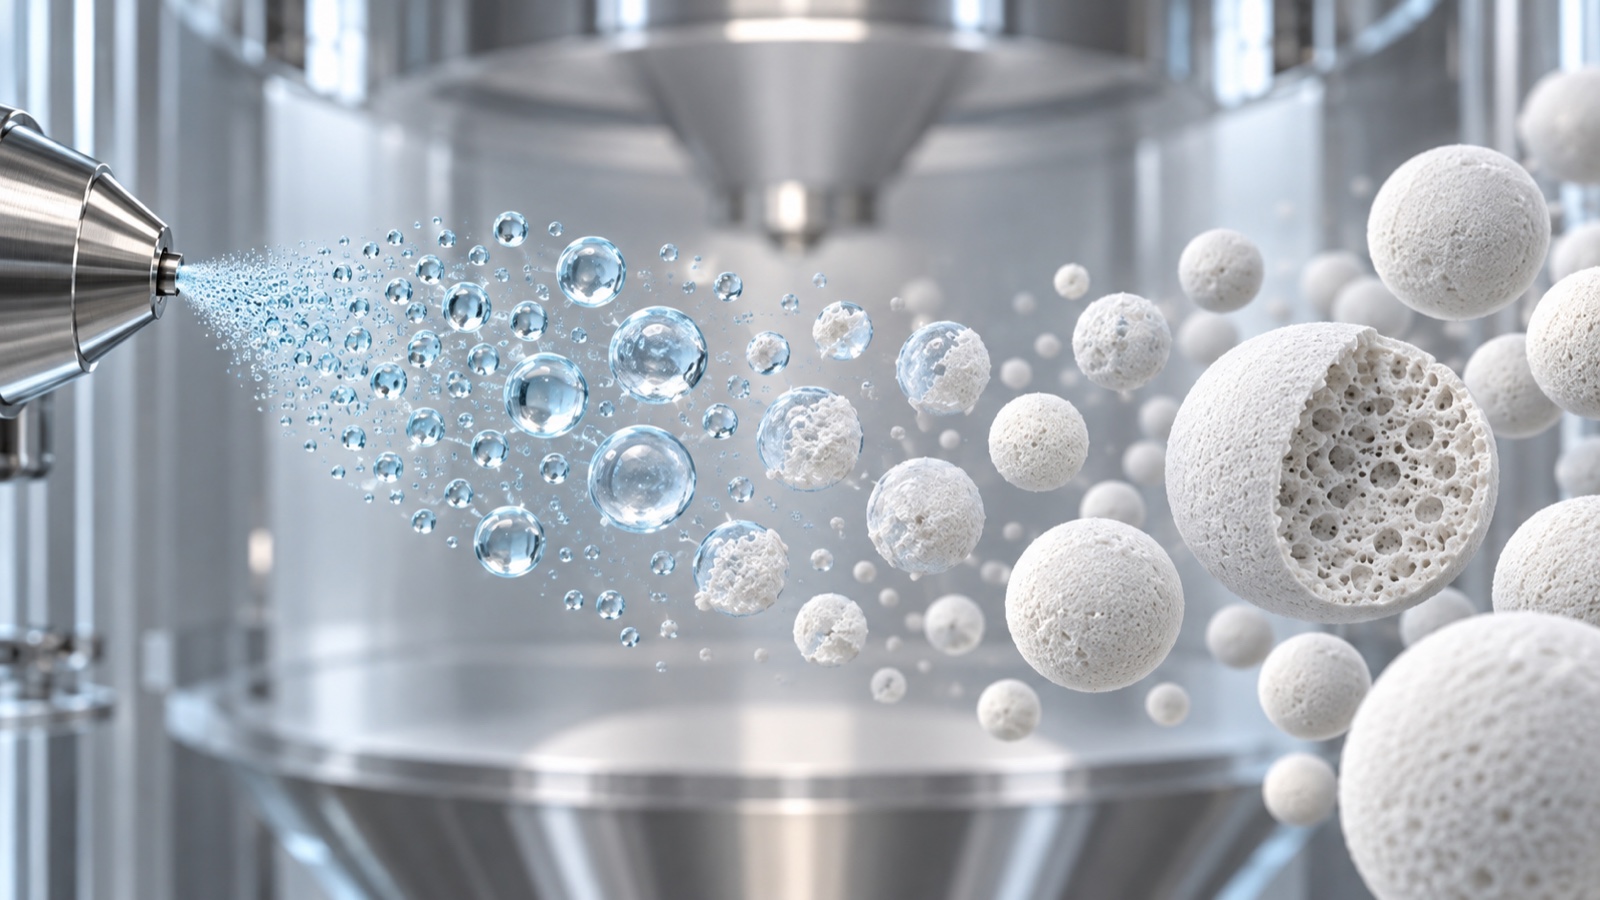
Spray drying can be viewed as four connected stages: HAp particles are dispersed in a liquid, the slurry is atomized into droplets, solvent migration and evaporation concentrate and contract each droplet, and the particles rearrange before the granule solidifies.
Final microsphere size is strongly influenced by droplet size. Internal structure also depends on the relative rates of solvent transport, particle migration, shell formation, and capillary shrinkage. Spray drying does not simply make existing powder round; it constructs a new secondary particle. The distinction between powder size and formed microsphere size must therefore be established before process results are compared.
What Rheological Window Did the Study Observe?
Park and colleagues prepared HAp by precipitation and used PVA to modify a 5 wt% HAp precursor slurry. All formulations were shear-thinning: apparent viscosity decreased as shear rate increased.
At 1 s−1, the PVA-free slurry had an apparent viscosity of about 180 mPa·s. Adding 15 g/L PVA increased it to about 880 mPa·s. The lower-viscosity formulations were more prone to collapsed or irregular particles. The 15 g/L PVA condition had an Ohnesorge number of about 2.42 and produced comparatively uniform, spherical particles with a mean diameter near 40 μm [1].
For this formulation and equipment, the authors identified approximately 800–900 mPa·s at 1 s−1 as a useful balance between droplet stabilization and atomization. PVA was not merely a thickener. It also acted as a temporary binder and could affect particle interactions, water retention, shell strength during drying, and later binder removal. The relationship between PVA concentration and particle shape should not therefore be assigned to one viscosity value alone.
One Viscosity Point Does Not Represent Atomization
The 800–900 mPa·s range was measured at the low shear rate of 1 s−1. Local shear conditions in tubing, pumps, and atomizers are usually much higher. In a shear-thinning suspension, the effective viscosity under those conditions can be substantially lower.
For process development, one viscosity point is not enough. A more useful data set includes:
| Process information | Question it helps answer |
|---|---|
| Complete flow curve | How does viscosity change from storage and pumping to atomization? |
| Thixotropy and recovery | Does the suspension rebuild after rest or circulation, and is it prone to settling? |
| Temperature | Does the test temperature match the actual feed condition? |
| Solids loading and density | Can similar viscosity values represent different particle loadings? |
| Particle size after dispersion | Is viscosity changing because of polymer thickening or particle agglomeration? |
Changing HAp surface area, agglomeration, PVA molecular weight, solids loading, nozzle geometry, or atomization pressure can shift the useful rheological window. The study should not be reduced to a recipe stating that 850 mPa·s will produce 40 μm microspheres.
What the Ohnesorge Number Adds, and What It Does Not
The Ohnesorge number (Oh) relates viscous effects to inertia and surface tension during droplet formation. Compared with reporting PVA concentration alone, it is closer to the force balance that governs atomization.
Oh is nevertheless conditional. Its calculation requires viscosity, density, surface tension, and a characteristic length. The measurement state used for each input and whether the characteristic length represents a nozzle, droplet, or another scale can change the result. The selected viscosity is particularly important for a non-Newtonian slurry.
Oh can explain trends within one experimental system and support process comparisons. Cross-equipment scale-up also requires nozzle geometry, pressure or rotational speed, feed rate, droplet-size distribution, and drying-gas conditions. Reproducing Oh = 2.42 alone does not reproduce the particles.
Sphericity, Pore Structure, and Phase Need Separate Evidence
The study found that rheological adjustment changed particle morphology, internal microstructure, and surface properties, while X-ray diffraction did not show a corresponding change in the HAp crystalline phase [1]. Material identity and engineered particle structure therefore remain separate questions.
- XRD primarily identifies whether the detectable crystalline phase remains HAp.
- SEM shows external shape, surface features, and cross-sections when samples are prepared appropriately.
- BET surface area and suitable porosity methods provide additional evidence about accessible surfaces and pores.
- Image analysis is needed to quantify sphericity, size distribution, fragments, and abnormal particles.
Pores visible in a surface SEM image do not establish a fully connected internal pore network. If porosity is a product requirement, the specification should define which attributes—such as pore size, pore volume, connectivity, or surface area—are relevant and pair them with suitable methods.
Unchanged phase identity after spray drying also does not mean that later thermal processing will leave crystallinity, pore structure, and granule strength unchanged. If the dried granules undergo debinding, sintering, or sieving, the final material must be characterized after those steps. Earlier studies likewise show that solids loading, atomization pressure, feed conditions, and PVA binder content can affect particle size, flowability, and granule strength in different ways [2–4].
A 40 μm Mean Is Not a 25–45 μm Specification
The paper's mean diameter near 40 μm is a statistical result for one experimental condition. A purchasing range such as 25–45 μm may instead describe a sieve interval, an image-analysis interval, a stated product range, or an acceptance limit. Similar numbers do not make these definitions equivalent.
To determine whether a lot meets a 25–45 μm requirement, the parties still need to define the method, whether the reported value is a mean or D50, allowable undersize and oversize fractions, treatment of attached particles and fragments, sampling, and the number of particles measured. These distinctions are discussed further in Why CaHA D50 and SEM Results May Not Match.
The study therefore explains how microspheres near 40 μm formed in one system. It does not demonstrate compliance with a commercial 25–45 μm specification or suitability for a particular medical use.
Four Layers of Manufacturing Evidence
The practical value of the study is not a new “optimal viscosity.” It is the ability to trace final particle attributes back to earlier process variables. For HAp microsphere development and lot management, evidence can be organized into four layers:
| Layer | Useful records |
|---|---|
| Starting particles | Phase, Ca/P reporting basis, D10/D50/D90, surface area, and agglomeration state |
| Slurry state | Solids loading, dispersion method, flow curve, structural recovery, density, surface tension, and stability |
| Atomization and drying | Equipment and nozzle, feed rate, atomization settings, inlet and outlet temperatures, gas flow, and yield |
| Final microspheres | Size distribution, out-of-range fractions, sphericity, fragments, surface and cross-section, porosity, phase, and lot variation |
Final testing shows what was made. Process records help explain why it was made that way. When equipment, binder, HAp feedstock, or slurry preparation changes, both kinds of evidence should be reviewed instead of checking only whether mean size remains near 40 μm. This is also the purpose of particle-manufacturing change control.
From a Size Number to Reproducible Manufacturing
A spherical HAp microsphere near 40 μm is not manufactured from a size target alone. It results from the combined effects of starting particles, dispersion, rheology, droplet scale, and drying consolidation.
The Park study establishes a useful link between slurry rheology and microsphere structure. It also supports a broader process judgment: viscosity cannot be discussed without its shear condition, and it cannot be optimized independently of atomization and drying. For development and purchasing, a method that connects raw material, process state, and final particles is more useful than copying 800–900 mPa·s, Oh = 2.42, or 40 μm as stand-alone targets.
This article interprets published technical research. The PVA concentration, slurry viscosity, Ohnesorge number, and microsphere size apply to the study's specific experimental system and are not universal formulations or release specifications for other HAp materials, manufacturing processes, or applications.
References
- Park TJ, Park OS, Lee JS, Jeong DY, Lee HS. Viscosity-controlled formation of spherical hydroxyapatite microspheres via spray drying. Chemical Engineering Research and Design. 2026;232:266–276. DOI: 10.1016/j.cherd.2026.07.001.
- Stunda-Zujeva A, Irbe Z, Berzina-Cimdina L. Controlling the morphology of ceramic and composite powders obtained via spray drying – A review. Ceramics International. 2017;43(15):11543–11551. DOI: 10.1016/j.ceramint.2017.05.023.
- Wang AJ, Lu YP, Zhu RF, Li ST, Ma XL. Effect of process parameters on the performance of spray dried hydroxyapatite microspheres. Powder Technology. 2009;191(1–2):1–6. DOI: 10.1016/j.powtec.2008.10.020.
- Navarrete-Segado P, Frances C, Grossin D, Tourbin M. Tailoring hydroxyapatite microspheres by spray-drying for powder bed fusion feedstock. Powder Technology. 2022;398:117116. DOI: 10.1016/j.powtec.2022.117116.