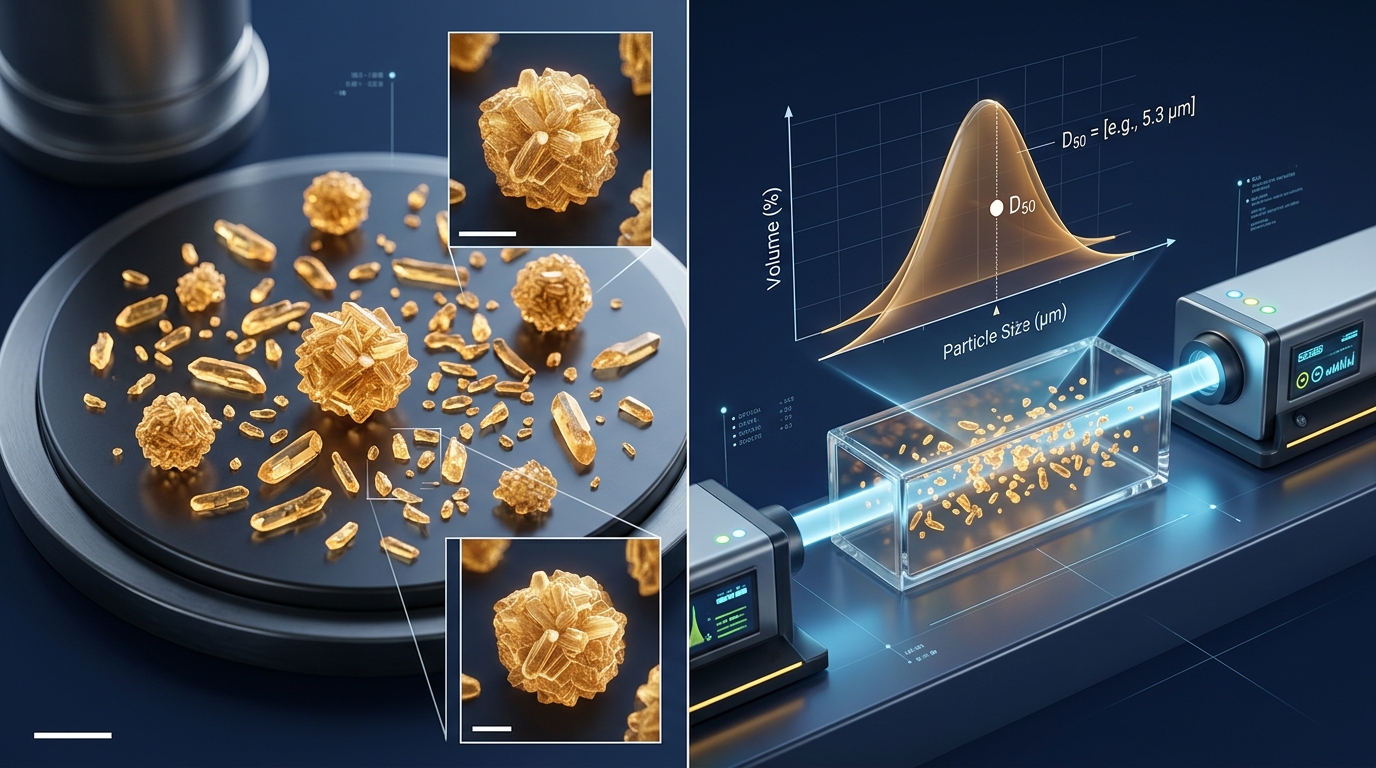
A Certificate of Analysis (COA) for CaHA powder reports:
D50 = 8 μm.
Yet when examining Scanning Electron Microscopy (SEM) micrographs of the same batch, an engineer or researcher often wonders:
“The particles in this image do not look like 8 μm at all. Did the particle size analyzer get it wrong?”
Another common scenario occurs when SEM reveals many fine particles, while laser diffraction reports a substantially larger D50.
This apparent discrepancy is not uncommon. In most cases, the issue is not instrument malfunction, but the use of two entirely different physical measurement principles as if they were identical rulers.
Understanding D50 in Its True Context
For standard laser diffraction reports, more precisely, D50 typically refers to the volume median diameter, D(v,0.5). It is not an "average particle diameter," nor does it imply that half of the individual particles in an SEM micrograph measure exactly that size.
In standard laser diffraction particle size analysis, the instrument records the light scattering pattern produced by an ensemble of particles and inverts this data into an equivalent spherical diameter distribution based on optical models. ISO 13320:2020 explicitly notes that laser diffraction utilizes spherical optical models so that the calculated distribution reproduces the measured scattering pattern. For non-spherical particles, the resulting equivalent size may differ from methods based on sedimentation, sieving, or direct imaging.
Therefore, a reported D50 should primarily be understood as: the median diameter of the particle population measured under a specific analytical method, dispersion condition, and volume-based statistical weighting. It does not describe a single "typical particle" seen under SEM. Once these concepts are decoupled, apparent contradictions become clear.
SEM Answers a Different Question
The strength of SEM is direct visual observation. It allows us to examine real morphological features: whether particles are spherical, plate-like, or irregular; whether fine fragments exist; whether the surface is dense or porous; and whether agglomeration is present.
However, an SEM micrograph captures only a microscopic fraction of the entire sample. When SEM images are used for quantitative particle size analysis, particles are recognized individually from their two-dimensional projections, generating size statistics based on defined 2D parameters such as equivalent circular diameter or Feret diameter (standardized under ISO 13322-1:2014). This is fundamentally a different physical measurand from the volume-based equivalent spherical diameter obtained via laser diffraction.
Crucially, manual or automated SEM image analysis typically operates on a particle-by-particle count—a number-weighted distribution. In contrast, standard laser diffraction reports a volume-weighted distribution. These two statistical bases assign vastly different weights to fine versus coarse particles.
For roughly spherical particles, volume scales with the cube of the diameter (V ∝ d³). Suppose a sample contains an overwhelming number of 1–2 μm fine particles mixed with a small fraction of noticeably larger particles. By count, the fine particles dominate, making the SEM field appear "full of small particles." However, because a small fraction of larger particles carries a disproportionately high weight in a volume-based distribution, the laser diffraction D(v,0.5) will reflect the significant volume contribution of larger particles.
Thus, it is entirely normal for SEM to show predominantly fine particles while laser diffraction reports a noticeably larger D50. Neither instrument is incorrect; they simply answer different mathematical questions.
Dispersion State: The Key Variable
For fine biomaterial powders such as CaHA and HAp, agglomeration is a decisive factor. (For a broader framework across material tiers, see our review on CaHA Powder, Microspheres, and Injectable Systems.)
Suppose a powder contains 1–3 μm primary particles. If they are adequately deagglomerated before testing, they may enter the measurement zone as separate scattering units. If they remain agglomerated, the larger cluster contributes scattering corresponding to a larger effective particle size.
Consequently, evaluating a D50 value requires knowing its complete method context:
- What dispersion medium was utilized;
- Whether dry or wet dispersion was performed;
- Whether a surfactant or dispersant was added;
- Whether ultrasonic dispersion was applied;
- The duration and power of sonication;
- Whether the dispersion remained stable throughout the measurement.
ISO 13320 encompasses sample preparation, instrument parameters, and measurement protocol within its standardized framework. Measurement repeatability relies fundamentally on representative sampling, stable dispersion, and appropriate optical models. This explains why two laboratories testing the exact same powder batch may obtain differing distribution curves if their sample preparation protocols diverge.
Agglomeration Is Sometimes Essential Information
A related question frequently arises: Is more aggressive dispersion always preferable?
Not necessarily. It depends entirely on the analytical objective.
If the goal is to characterize the dispersed-particle size under a defined deagglomeration protocol, sample preparation should establish a stable and reproducible dispersed state. However, if the research aims to assess how the powder behaves or agglomerates in a specific carrier formulation, excessive sonication will destroy the very agglomerate structure under investigation.
Method development for particle sizing is not merely about generating a number, but defining: Which material state should this distribution represent? Industry guidance emphasizes that dispersion protocols must align with the analytical purpose.
Which Is More Accurate: SEM or Laser Diffraction?
The question of which method is "more accurate" is inherently flawed. A more constructive question is: What problem are we trying to solve?
To characterize the bulk population of a powder batch rapidly and reproducibly, laser diffraction rapidly samples a large particle ensemble to obtain D10, D50, and D90 control metrics. To investigate why a distribution behaves as it does, SEM provides essential morphological insights: particle geometry, agglomeration mechanisms, fines, and surface textures. (See our discussion on SEM Methodology for CaHA Microspheres.)
In CaHA material characterization, these techniques should be evaluated in tandem rather than treated as competing claims. For instance, if the coarse end of the particle-size distribution develops an unexpected tail and D90 shifts toward larger sizes, laser diffraction indicates an increased contribution from larger scattering units. SEM examination can then reveal the physical cause: whether it stems from genuine large primary particles, cohesive agglomerates of fine crystals, or processing outliers. Identical distribution curve shapes can originate from entirely different physical mechanisms.
Why D50 Alone Cannot Compare Two Powder Batches
Suppose Batch A has a D50 of 8.1 μm and Batch B has a D50 of 8.2 μm. Based solely on these numbers, the two materials appear virtually identical.
However, reviewing the full distribution curves may reveal that Batch A has a narrow, monomodal span, whereas Batch B exhibits a broad distribution containing substantial fractions of both fine particles and coarse particles or agglomerates, yielding a similar median purely by coincidence.
D50 is a valuable summary metric, but it compresses an entire continuous distribution into a single value. For robust long-term quality control, monitoring the full distribution curve under standardized protocols provides far greater assurance of batch-to-batch consistency. In their analysis of ASTM interlaboratory round-robin tests, NIST researchers showed that particle-size-distribution comparability depends heavily on consistent test execution.
Clarifying Ambiguous Specifications Like "<10 μm"
In technical documentation and specifications, stating simply: Particle size <10 μm can lead to significant misunderstandings. It could be interpreted as:
- D50 <10 μm;
- D90 <10 μm;
- A specified or observed upper particle-size limit;
- A sieve mesh rating;
- An image-analysis size metric.
These definitions represent vastly different material specifications. If the intended criterion is median diameter, it should explicitly state: D50 <10 μm or D50 ≤20 μm. Explicit notation prevents discrepancies during downstream formulation, composite compounding, and process validation.
Conclusion: Harmonizing Complementary Evidence
When encountering a scenario where laser diffraction reports D50 = 8 μm but SEM micrographs appear different, the initial reaction should not be to assume an error. Instead, evaluate three questions:
- Are both methods assessing the same particle state (primary particles vs. agglomerates)?
- Are the results expressed on the same statistical basis (number vs. volume weighting)?
- Were the two techniques designed to answer fundamentally different physical questions?
Reliable biomaterial characterization does not require disparate analytical tools to yield identical numerical values. Rather, it requires different methods to describe the same material from complementary perspectives in a physically coherent manner. D50 defines where the particle population lies; SEM reveals what those particles physically look like.
Technical review: Nanjing Junzhuo Materials Technology Team. This article provides technical insights into particle size characterization and methodological differences for CaHA/HAp powders. Specific product specifications should be referenced against official certificates of analysis, validated test protocols, and quality documentation.
References
- ISO 13320:2020. Particle size analysis — Laser diffraction methods. International Organization for Standardization (ISO), systematically reviewed and confirmed in 2025.
- ISO 13322-1:2014. Particle size analysis — Image analysis methods — Part 1: Static image analysis methods. International Organization for Standardization (ISO), systematically reviewed and confirmed in 2025.
- Ferraris CF, Hackley VA, Avilés AI. Measurement of Particle Size Distribution in Portland Cement Powder: Analysis of ASTM Round Robin Studies. Cement, Concrete and Aggregates. 2004;26(2):71–81. DOI: 10.1520/CCA11920.