In aesthetic-material literature and product communication, scanning electron microscopy (SEM) images of CaHA microspheres are often treated as a visual calling card. Particle roundness, surface texture, and size uniformity can all be seen directly in the image.
The more intuitive the image looks, the more important the first question becomes: are we seeing a stable material feature, or the combined result of sample preparation, field selection, and statistical treatment?
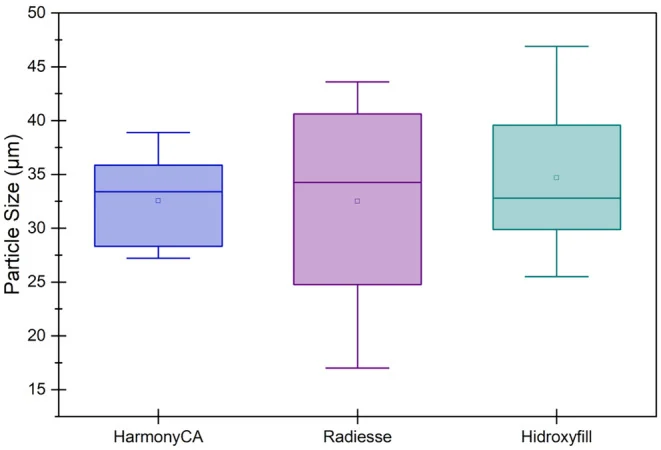
A 2025 article in the Journal of Cosmetic Dermatology, followed by a 2026 comment and author response, brought this issue into focus. The discussion centered on SEM observation of three CaHA-based dermal fillers marketed in Mexico. Its value is not a simple ranking of products, but a methodological reminder: before interpreting microsphere morphology, the sampling and measurement method must be strong enough to support the conclusion.
SEM Images Are Outputs of Sample Preparation
CaHA-based dermal fillers are not supplied as dry microsphere powders. The microspheres are usually dispersed in a gel carrier. To observe them under SEM, the sample must go through collection, separation, washing, drying, and sputter coating steps.
Each step can influence the final image. Incomplete separation may lead to particle aggregation after drying. Gel residue may cover the particle surface. Centrifugation, washing, and drying conditions may also change the sample state. An irregular contour in the final image may reflect the particle itself, but it may also reflect the preparation process.
For this reason, SEM images from different studies or samples are most comparable when preparation workflow, magnification, field selection, and statistical method are similar. The image is useful, but it cannot be interpreted independently of the methodology.
A Few Fields Cannot Represent a Full Batch
SEM observation usually covers only a small portion of the sample. If a study captures only a few fields or measures only a limited number of particles, the result is better treated as an initial observation than as a full judgment of an entire syringe, batch, or material system.
A few round microspheres in one image do not prove that all particles share the same morphology. A few irregular particles in one field do not automatically prove the same issue across the whole batch. A stronger approach requires more fields, randomized sampling, a sufficient particle count, and, where possible, multi-batch comparison.
For material-development teams, the useful goal is not to select the most attractive image. It is to establish an observation method that is repeatable, comparable, and statistically meaningful.
Statistics Define What an Image Can Support
The difficult part of morphology comparison is not whether images exist. It is whether the images were obtained under comparable conditions. How the sample is separated from the gel, how it is washed and dried, what magnification is used, how fields are selected, and how many particles are measured all shape the boundary of the conclusion.
If methods differ, image differences may contain both product-related variation and method-related variation. This is why the comment and response are useful: they move the discussion from what the particles look like to how the images and measurements were obtained.
A careful SEM report should state the magnification, sample-processing steps, number of fields, particle-counting approach, statistical method, and batch information. When those details are missing, the conclusion should remain restrained.
Morphology Matters, but It Cannot Replace Clinical Evidence
The size, sphericity, surface condition, and particle size distribution of CaHA microspheres are all worth studying. These characteristics are relevant to dispersion in a carrier, formulation stability, injectability and extrusion-force testing, and downstream product verification.
However, there are many layers between “the particles look more spherical” and “the clinical performance is better”: formulation system, rheology, sterilization and stability, biological testing, animal studies, clinical studies, and long-term follow-up. Skipping these layers turns a material-characterization image into a clinical conclusion it cannot support.
SEM can show how microspheres appear under defined preparation and observation conditions. By itself, it cannot answer questions about tissue response, safety, or clinical performance after a material is used in the body.
SEM Images Belong in Material Technical Files
For R&D, quality control, and technical communication with customers, SEM images are best treated as part of the material technical file, not as stand-alone marketing evidence. For HAp/CaHA fully solid, dense microspheres, morphology images should be interpreted together with particle size distribution, sphericity, crystalline phase, phase purity, batch consistency, endotoxin control, microbiological limits, heavy metals, and traceability records.
Nanjing Junzhuo Biotechnology Co., Ltd. provides HAp/CaHA microsphere and powder raw materials for regenerative aesthetic formulation development, bone repair, coatings, and research translation. SEM imaging can record how a sample appears under defined preparation and observation conditions, but the more useful deliverable is a reproducible testing workflow, batch data, and supporting documentation.
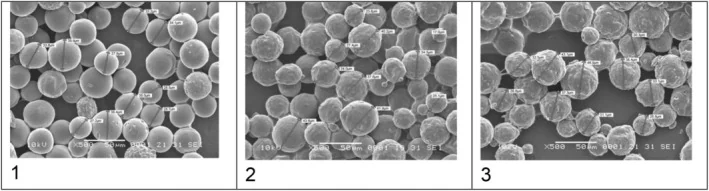
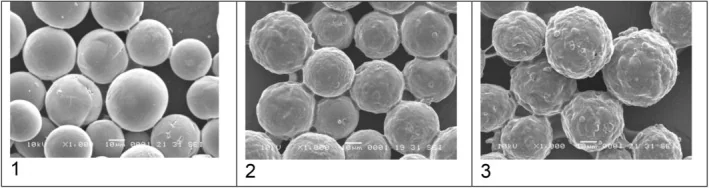
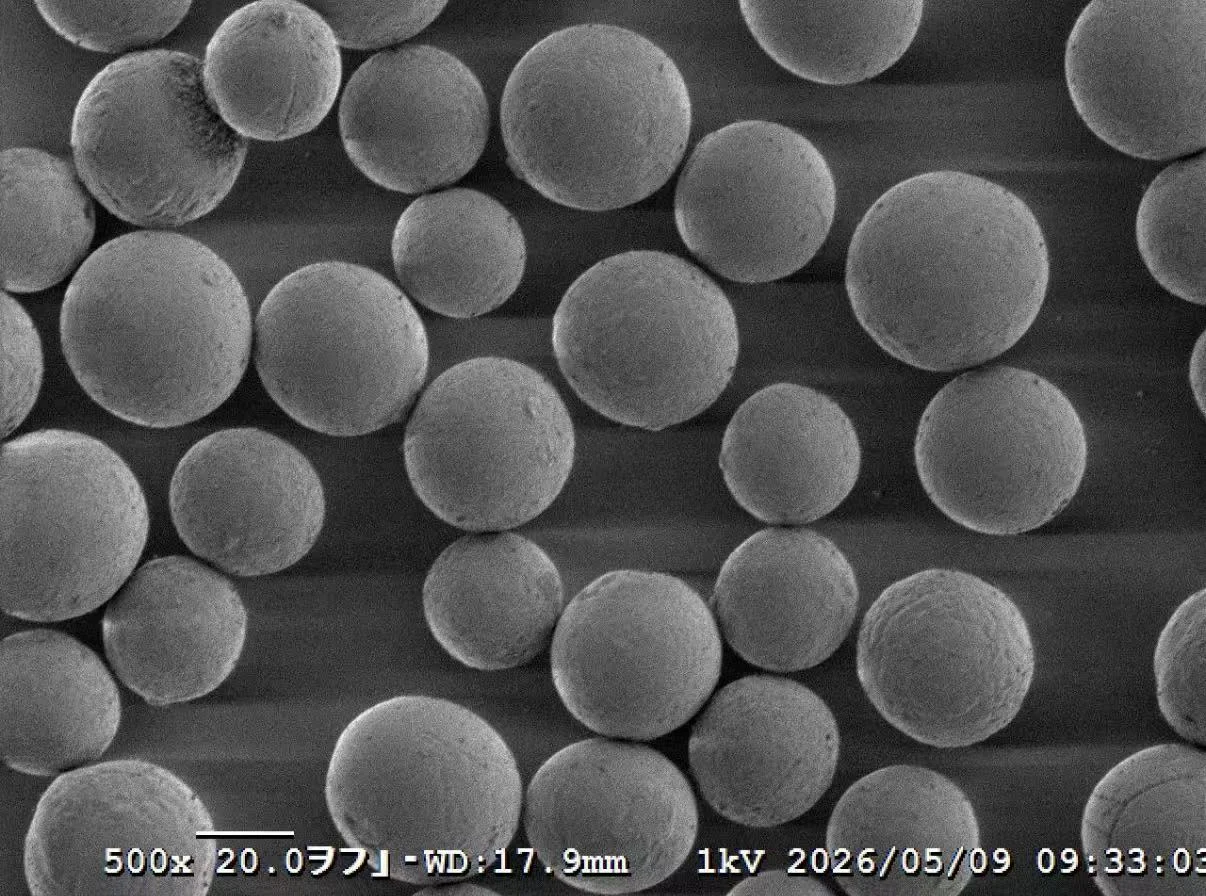
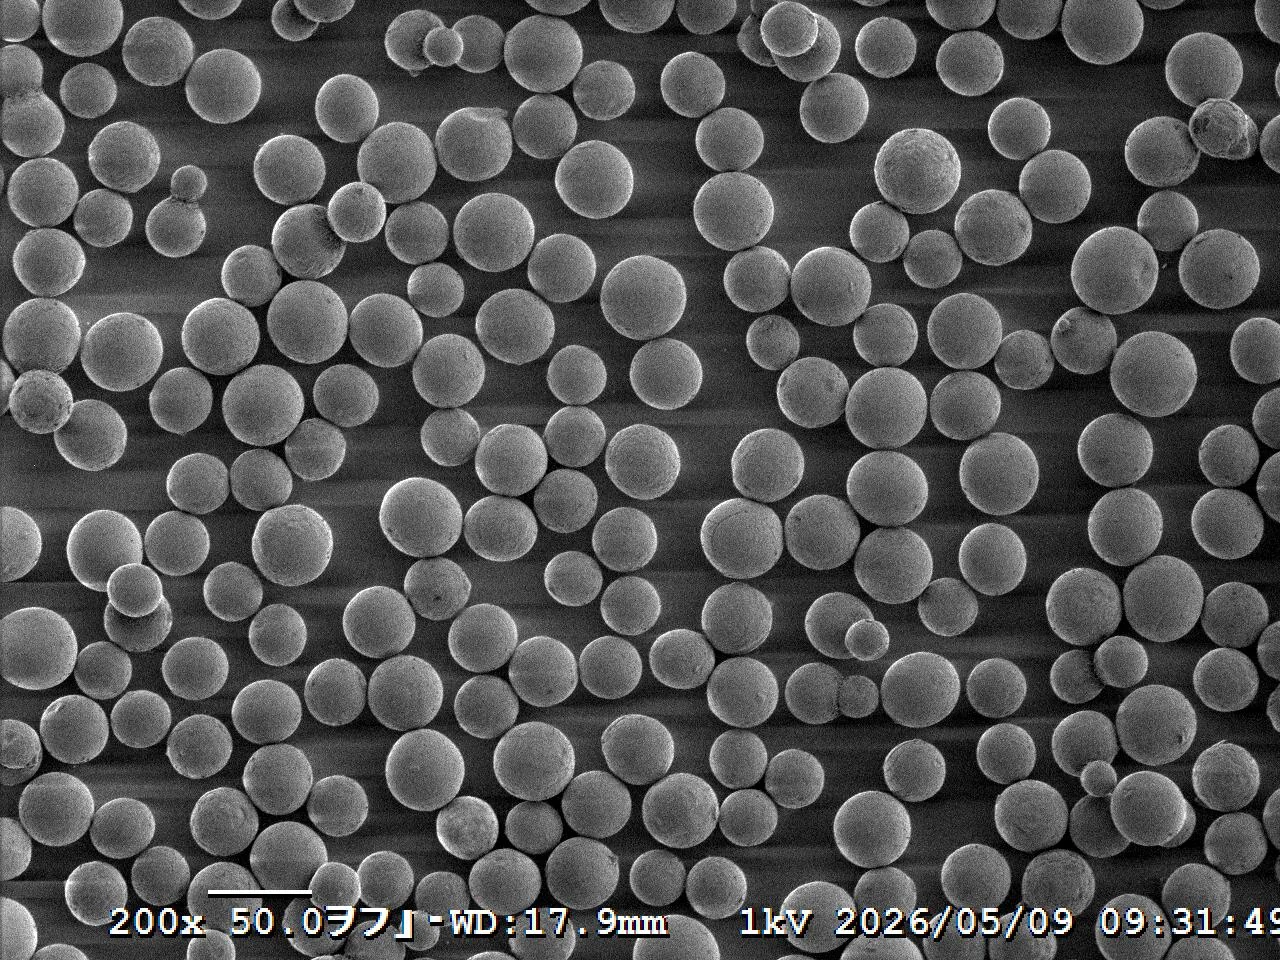
The following two SEM images show HAp/CaHA fully solid, dense microspheres from Nanjing Junzhuo Biotechnology Co., Ltd. The original magnification, scale bar, and capture time are retained. They are included to show how morphology can be recorded in a company material file, not to evaluate any finished injectable filler product or clinical outcome.
Conclusion: Images Are a Starting Point, Not the Endpoint
The JCD discussion around three CaHA-based fillers marketed in Mexico does not provide a simple product ranking. Its more important question is methodological: when we use SEM to evaluate microspheres, are we seeing material differences, or differences introduced by sample handling, field selection, and statistical approach?
CaHA microsphere morphology remains important. The more intuitive the image, the more transparent the method, sampling depth, data reporting, and interpretation need to be.
For HAp/CaHA microsphere development, production, and quality communication, repeatable, comparable, and statistically supported morphology characterization is part of the material technical file. Whether a photo looks attractive matters less than whether the method is transparent, the data represent the sample, and the results can be independently reproduced or verified.
This article is intended for literature interpretation and material-characterization discussion only. It discusses SEM characterization, sampling statistics, and evidence boundaries for CaHA microspheres, and does not provide medical product recommendations, clinical indications, or treatment advice.
References
- Sanchez Rico G A, Andrade Canto S B. Three Calcium Hydroxylapatite-Based Dermal Fillers Marketed in Mexico: Comparison of Particle Size and Shape Using Electron Microscopy. Journal of Cosmetic Dermatology. 2025;24(3):e70100. DOI: 10.1111/jocd.70100.
- Furman-Assaf S, Korman S. Re: “Three Calcium Hydroxylapatite-Based Dermal Fillers Marketed in Mexico: Comparison of Particle Size and Shape Using Electron Microscopy” by Sanchez Rico and Andrade Canto, Journal of Cosmetic Dermatology 2025; 24(3): e70100. Journal of Cosmetic Dermatology. 2026;25(3):e70758. DOI: 10.1111/jocd.70758.
- Sanchez Rico G A, Canto S B A. Response to: “Comment on ‘Three Calcium Hydroxyapatite-Based Dermal Fillers Marketed in Mexico: Comparison of Particle Size and Shape Using Electron Microscopy’”. Journal of Cosmetic Dermatology. 2026;25(6):e70985. DOI: 10.1111/jocd.70985.