Particle size is often one of the first specifications compared in CaHA injectable materials. If two systems both report about 30% CaHA by volume, a 25–45 μm particle range, and carriers based primarily on water for injection, glycerol, and sodium carboxymethylcellulose, should their in vitro behavior also be similar?
A 2026 Biomedicines study compared two commercial CaHA injectable systems, identified as Sample R and Sample S. Primary human dermal fibroblasts were exposed to the complete injectable systems, while scanning electron microscopy (SEM) was performed on CaHA microspheres isolated after removal of the carrier.
The results did not support a simple assumption that similar reported specifications must produce similar material responses. Differences emerged in later MTT signals, collagen- and elastin-related gene expression, and microsphere surface morphology. This was an in vitro cell study with qualitative SEM comparison, not a clinical study or a ranking of treatment outcomes.
25–45 μm Was a Manufacturer-Reported Range
The 25–45 μm range came from manufacturer information. The researchers did not independently measure the full particle-size distributions, produce size histograms, or report D10, D50, and D90 values for the two samples.
The study therefore establishes that both products were described as containing 25–45 μm CaHA particles. It does not establish that their actual particle-size distributions were identical. Even when two groups of microspheres are described by the same range, their distribution centers, widths, and out-of-range fractions may still differ.
For specification management, a reported range should be separated from batch-specific measurements obtained with a defined sampling and analytical method. Both types of information are useful, but they are not interchangeable.
SEM Differences Were Most Visible at the Surface
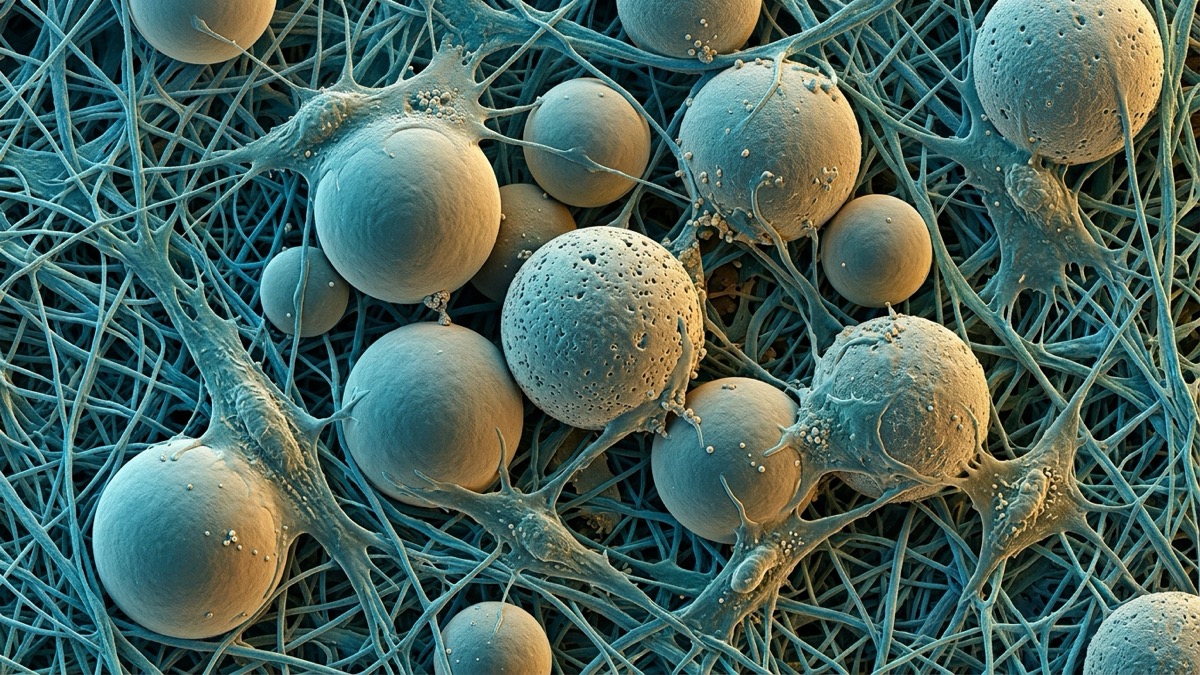
Both samples were composed mainly of spherical microspheres, without extensive fragmentation or grossly deformed particles. At higher magnification, Sample R showed a more microgranular, nodular, and heterogeneous surface, whereas Sample S appeared smoother and more homogeneous.
This observation adds information beyond overall sphericity. Cells encounter the physical particle surface, not the size range printed in product documentation. SEM images must still be interpreted in the context of sample preparation. In this study, the carrier was removed and the microspheres were washed, centrifuged, and dried. The final images may reflect native surface features, preparation effects, or both. Our earlier review of SEM methodology for CaHA microspheres discusses this limitation in more detail.
The study did not quantify surface roughness or compare particles engineered to differ only in surface structure. The observed morphology is therefore a candidate explanation for the cell results, not a confirmed mechanism.
When Did the Cellular Responses Diverge?
MTT signals were measured at 24, 36, 48, and 72 hours with the materials tested at 10 mg/mL. No significant difference between the two samples was reported at 24 or 36 hours. Sample S produced higher signals at 48 and 72 hours.
| Reported endpoint | Sample R | Sample S |
|---|---|---|
| 48-hour MTT signal relative to normalized control | about +9.1% | about +18.7% |
| 72-hour MTT signal relative to normalized control | about +12.8% | about +43.6% |
| Type I collagen-related gene expression at 72 hours versus control | about +11.6%; not statistically significant | about +22.9%; P<0.01 |
| Elastin-related gene expression at 72 hours versus control | about +17.0%; not statistically significant | about +34.0%; P<0.01 |
Each quantitative condition used triplicate measurements (n=3), and the cells came from one healthy donor. The n=3 value should not be read as three independent donors or three independent biological studies.
The study measured MTT metabolic signal and mRNA expression. It did not directly quantify cell proliferation, collagen protein deposition, or elastic-fiber formation. A 43.6% increase in MTT signal is not equivalent to a 43.6% increase in cell number, and higher gene expression is not proof that more collagen had already formed.
Did Surface Morphology Cause the Different Responses?
The current evidence cannot establish that causal link. Fibroblasts were exposed to the complete injectable systems, whereas SEM examined carrier-free, dried microspheres. Differences in the cell experiments may relate to particle surfaces, carrier state, actual particle distribution, or other unmeasured material features.
The study also did not include X-ray diffraction (XRD). It is therefore not possible to determine whether the two microsphere samples had equivalent crystalline phases or crystallinity. The available evidence covers reported composition, qualitative morphology, and short-term cell response, but not the full material identity of either system.
Specification Data Can Be Read at Three Levels
The study is most useful when it is used to separate three kinds of information: reported specifications, batch-specific measurements, and complete-system performance.
| Information level | Question answered | Typical information |
|---|---|---|
| Reported specification | What design and supply window is stated? | CaHA volume fraction, reported particle range, main carrier components |
| Batch-specific measurement | What is the actual state of the particle population in this batch? | Sampling method, particle count, D10/D50/D90, in-range fraction, morphology statistics |
| Complete-system performance | How do the particles behave after formulation with the carrier? | Dispersion, rheology, injectability, stability, and biological evaluation under defined conditions |
A reported range defines a design window. Batch measurements characterize the actual particle population. Complete-system testing asks whether the particles remain controlled after incorporation into the carrier. Omitting any one level makes it easier to confuse a shared material name or similar specification with material equivalence.
A reported range cannot replace particle-population statistics. One SEM image cannot replace representative morphology analysis. In vitro cell results also cannot be used in reverse to prove that one particular surface structure caused the response.
In Vitro Findings Are Not a Clinical Ranking
The experiment used one cell source, one material concentration, and a maximum observation period of 72 hours. It did not include immune cells, vascular context, long-term tissue remodeling, animal studies, or human comparison.
The conflict-of-interest statement reports that one author occasionally provides consulting services to ILIKIA. Bibiana Franzen Matte is employed by Nucleo Vitro, which performed the in vitro work. The paper also states that ILIKIA had no role in study design, data collection, analysis or interpretation, manuscript preparation, or the decision to publish. In a commercial product comparison, this disclosure should be considered alongside the methods, sample size, and statistical design.
The same manufacturer-reported particle range does not establish that two complete CaHA systems have the same particle characteristics or in vitro response. Conversely, a short-term in vitro difference does not establish superior clinical safety, duration, or treatment outcome for either product.
This article is a materials-focused review of published work on CaHA microsphere morphology, specification reporting, and in vitro cell findings. It does not rank commercial products, recommend a medical product, or assess clinical efficacy.
References
- Dal Col V, Matte BF. Calcium Hydroxyapatite Biostimulators: A Comparative Study of Biological Response and Particle Morphology. Biomedicines. 2026;14(7):1447. DOI: 10.3390/biomedicines14071447.